Beta coming soon — join the waitlist
Talk to your AI. Get live workspaces you can actually share.
Works with Claude, ChatGPT, and more
Deckspace turns your AI conversations into live workspaces — persistent, shareable workspaces filled with charts, dashboards, kanban boards, and more. No copy-pasting into slides. No rebuilding in spreadsheets.
You already use AI for analysis. But then what?
Your AI gives you great answers — buried in a chat thread. To share them, you copy-paste into spreadsheets, rebuild charts in slides, and lose half the context along the way. Deckspace skips all of that.
Join the waitlistFrom conversation to live workspace in minutes
No setup, no config files, no learning curve. You talk to your AI — Deckspace renders the results.
Step 1
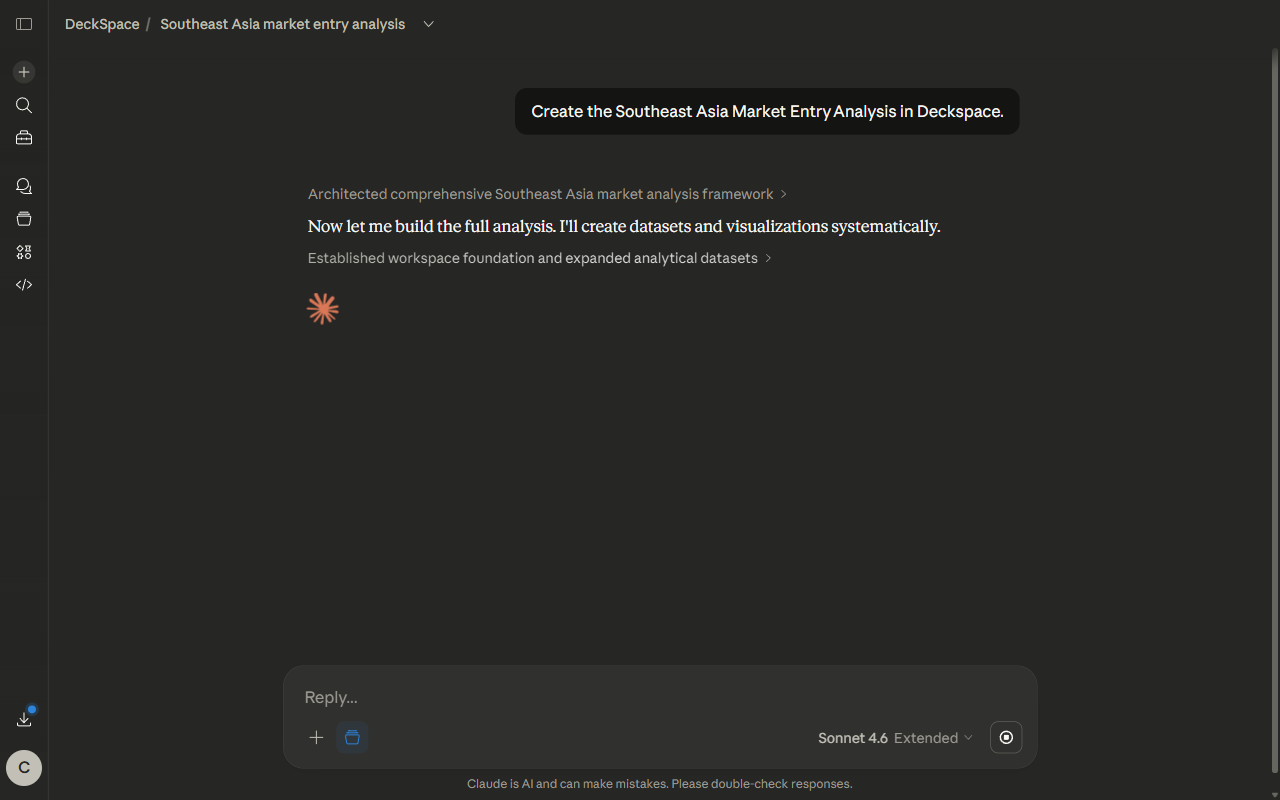
Talk to your AI like you normally would
“Analyze my Q4 spending by category.” “Track these competitors across pricing, features, and reviews.” “Build a project board for the launch.” Just describe what you need. Your AI knows how to use Deckspace automatically — whether you’re on Claude, ChatGPT, or another client.
Step 2
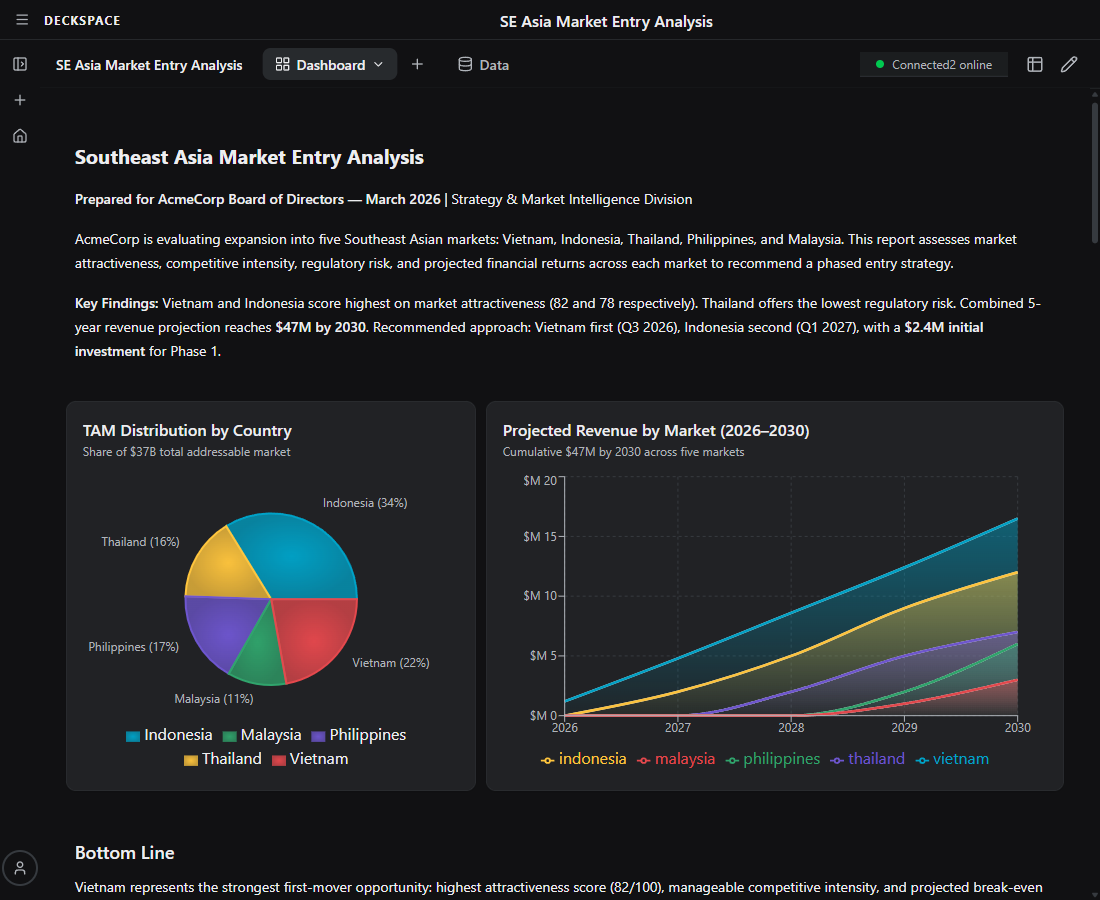
See your workspace take shape in real time
Charts, tables, kanban boards, diagrams — your AI picks the right format and Deckspace renders it while you’re still talking. Everything lands on a grid layout that looks designed, not auto-generated. Ready to present the moment it’s done.
Step 3
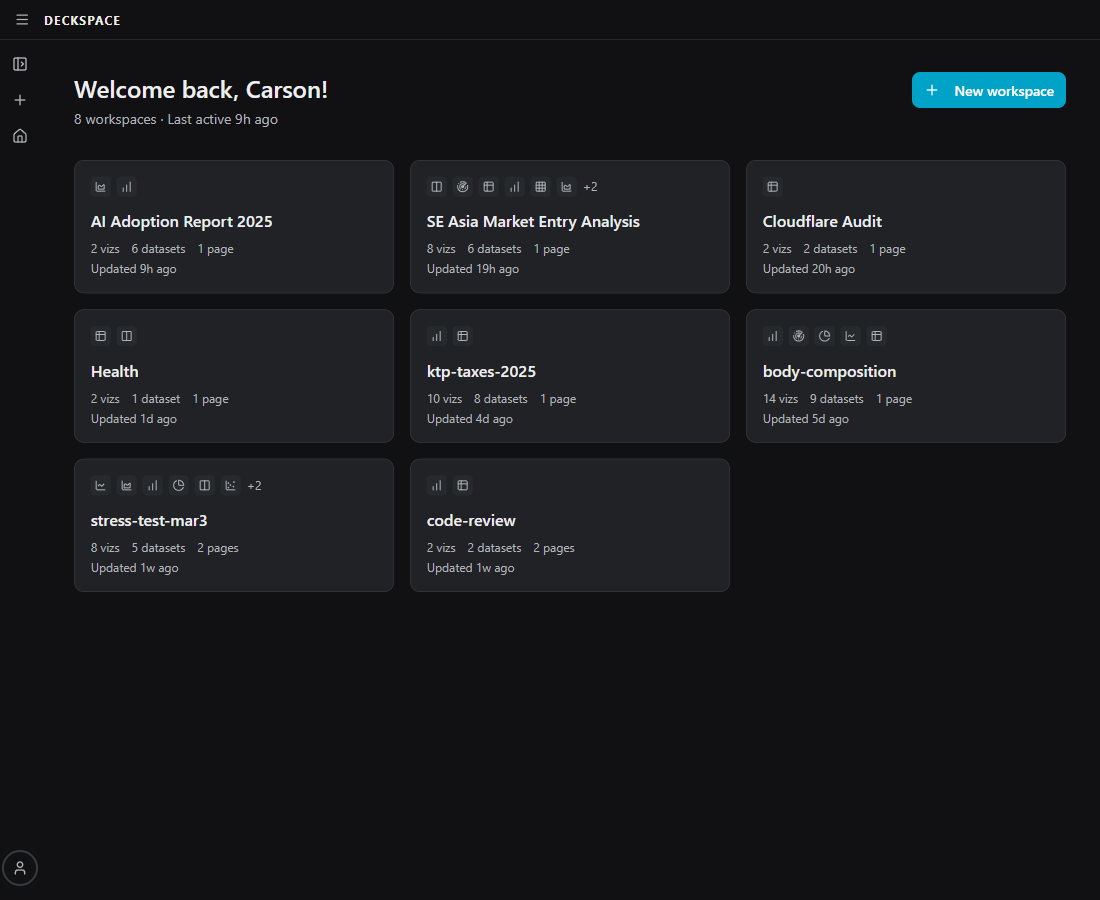
Come back tomorrow. It’s all still there.
Your workspace persists across sessions. Add new data, ask follow-up questions, refine the analysis — your AI picks up where you left off. No re-explaining context. No starting from scratch. Your insights compound over time.
Step 4
Share a link. Not a screenshot.
Send your live workspace to your team, your client, or your stakeholders. They see a polished, interactive workspace — not a static export. They can even bring their own AI to add analysis on top.
A live workspace can be anything
A live workspace takes whatever shape your conversation needs — and Deckspace renders it with dozens of visualization types.
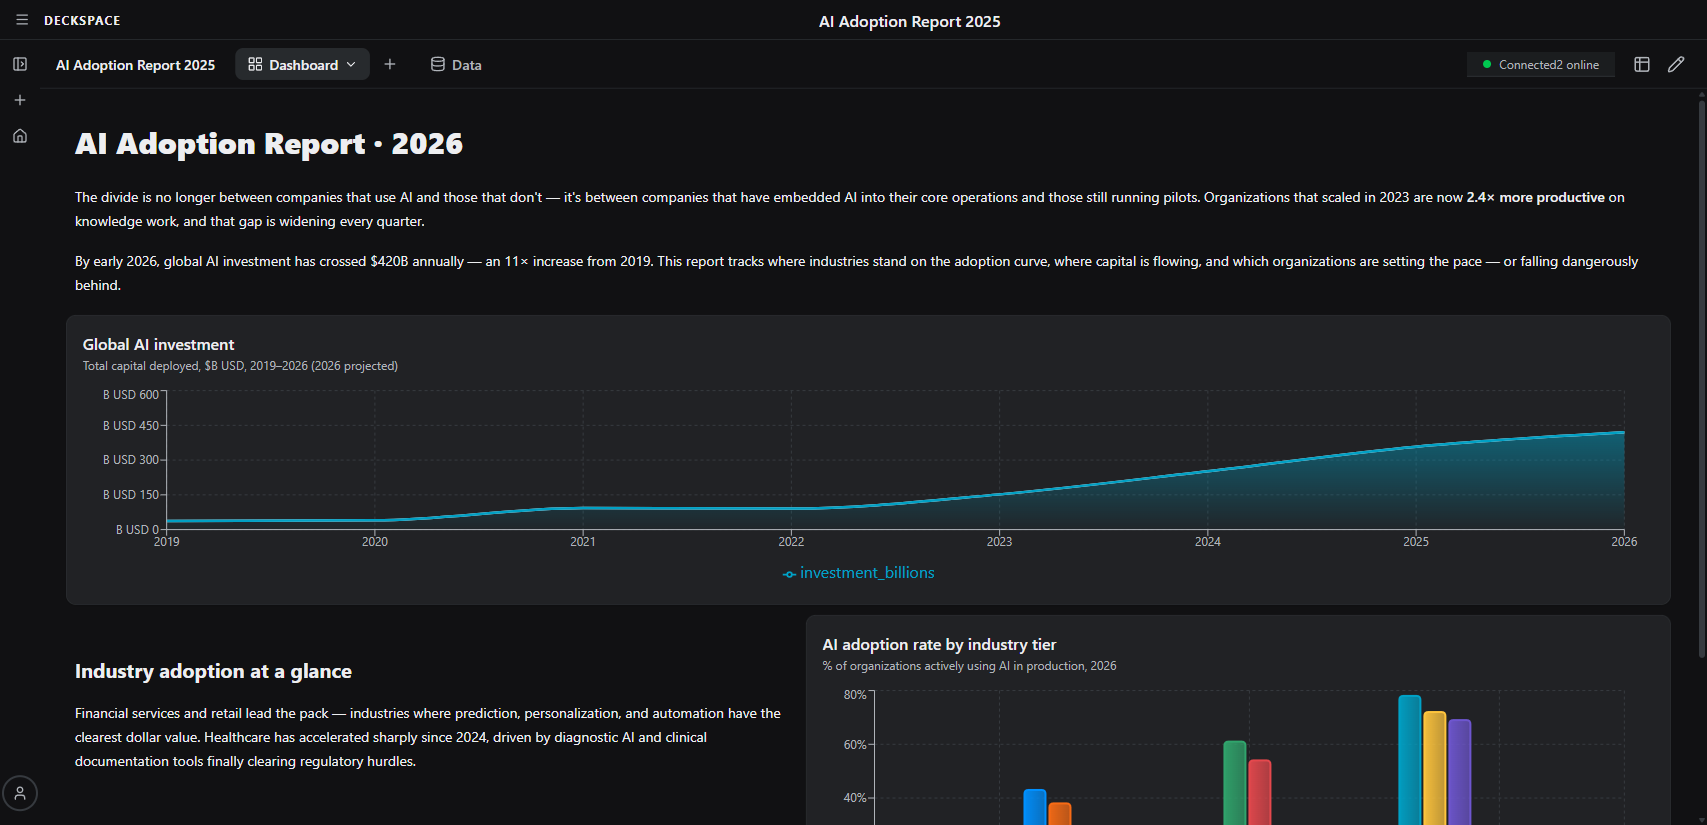
Spending Dashboard
Charts, breakdowns, and trends from your financial data
Project Board
Kanban columns, timelines, and status tables for your team
Competitive Analysis
Side-by-side comparisons across pricing, features, and positioning
Research Brief
Key findings, supporting charts, and recommendations in one view
Client Report
Polished tables and visuals you can share with a link
Data Exploration
Scatter plots, heatmaps, and distributions from any dataset
People are using Deckspace to…
Explore datasets
Ask your AI to break down CSVs, APIs, or raw data. Deckspace renders the charts and tables so you can share them.
Run project reviews
Ask your AI for velocity charts, blockers, and burn-down reports. Share the workspace with your team.
Analyze finances
Have your AI build spending breakdowns, net worth trends, and budget views. Share with your partner or advisor.
Build client reports
Turn your AI’s research and analysis into polished, shareable deliverables. Send a link instead of a PDF.
Compare competitors
Have your AI lay out pricing, features, and positioning across your market. Keep the workspace updated as things change.
Plan product launches
Ask your AI to build kanban boards, timelines, and resource tables. Deckspace makes them easy to share and revisit.
Your next AI conversation could be a live workspace by lunch.
Free when it launches. Sign up now and be first in line when beta opens.
Join the waitlist